Anna
Dyrektor Sprzedaży
Dyrektor Sprzedaży
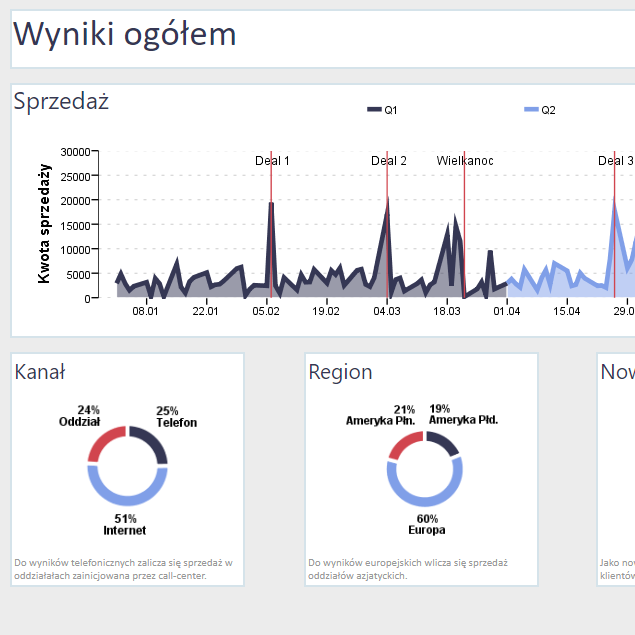
Raport sprzedażowy to dla mnie jedno z podstawowych narzędzi pracy. Pozwala na bieżąco ocenić wolumen i strukturę sprzedaży, a także pracę zespołu. Umożliwia natychmiastową reakcję na problemy.
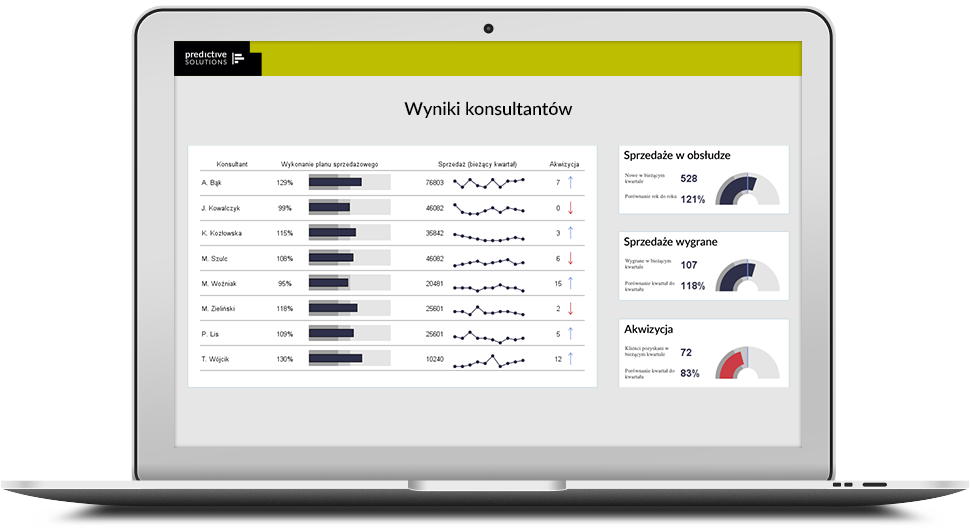
Poznanie struktury sprzedaży i jej dynamiki umożliwia szybsze podejmowanie trafnych decyzji. Korzystając z założonych dla sprzedawców progów mogę łatwo ocenić, które regiony dobrze sobie radzą, a które wymagają wsparcia. Raporty PS IMAGO PRO są cyklicznie aktualizowane i dostępne są przez nasz firmowy portal WWW - dzięki temu mogę sprawdzić dane w każdej chwili, bez czekania na opracowanie ich przez analityka.